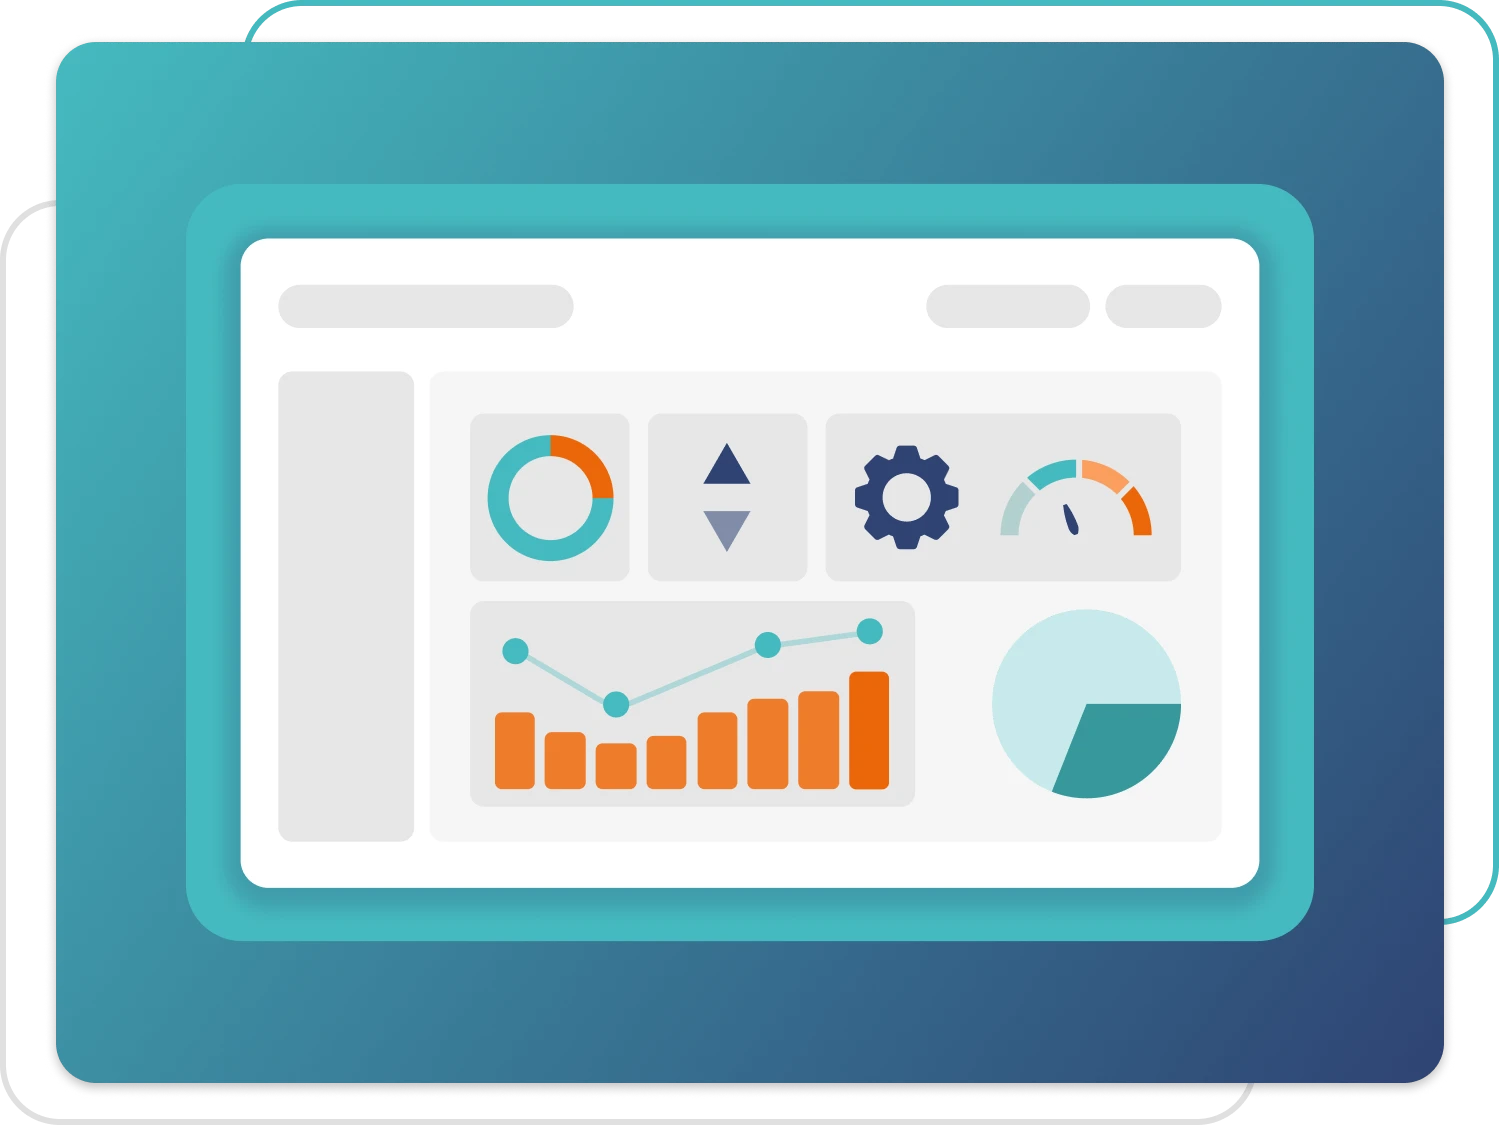
Custom Industrial Dashboards for Your Production
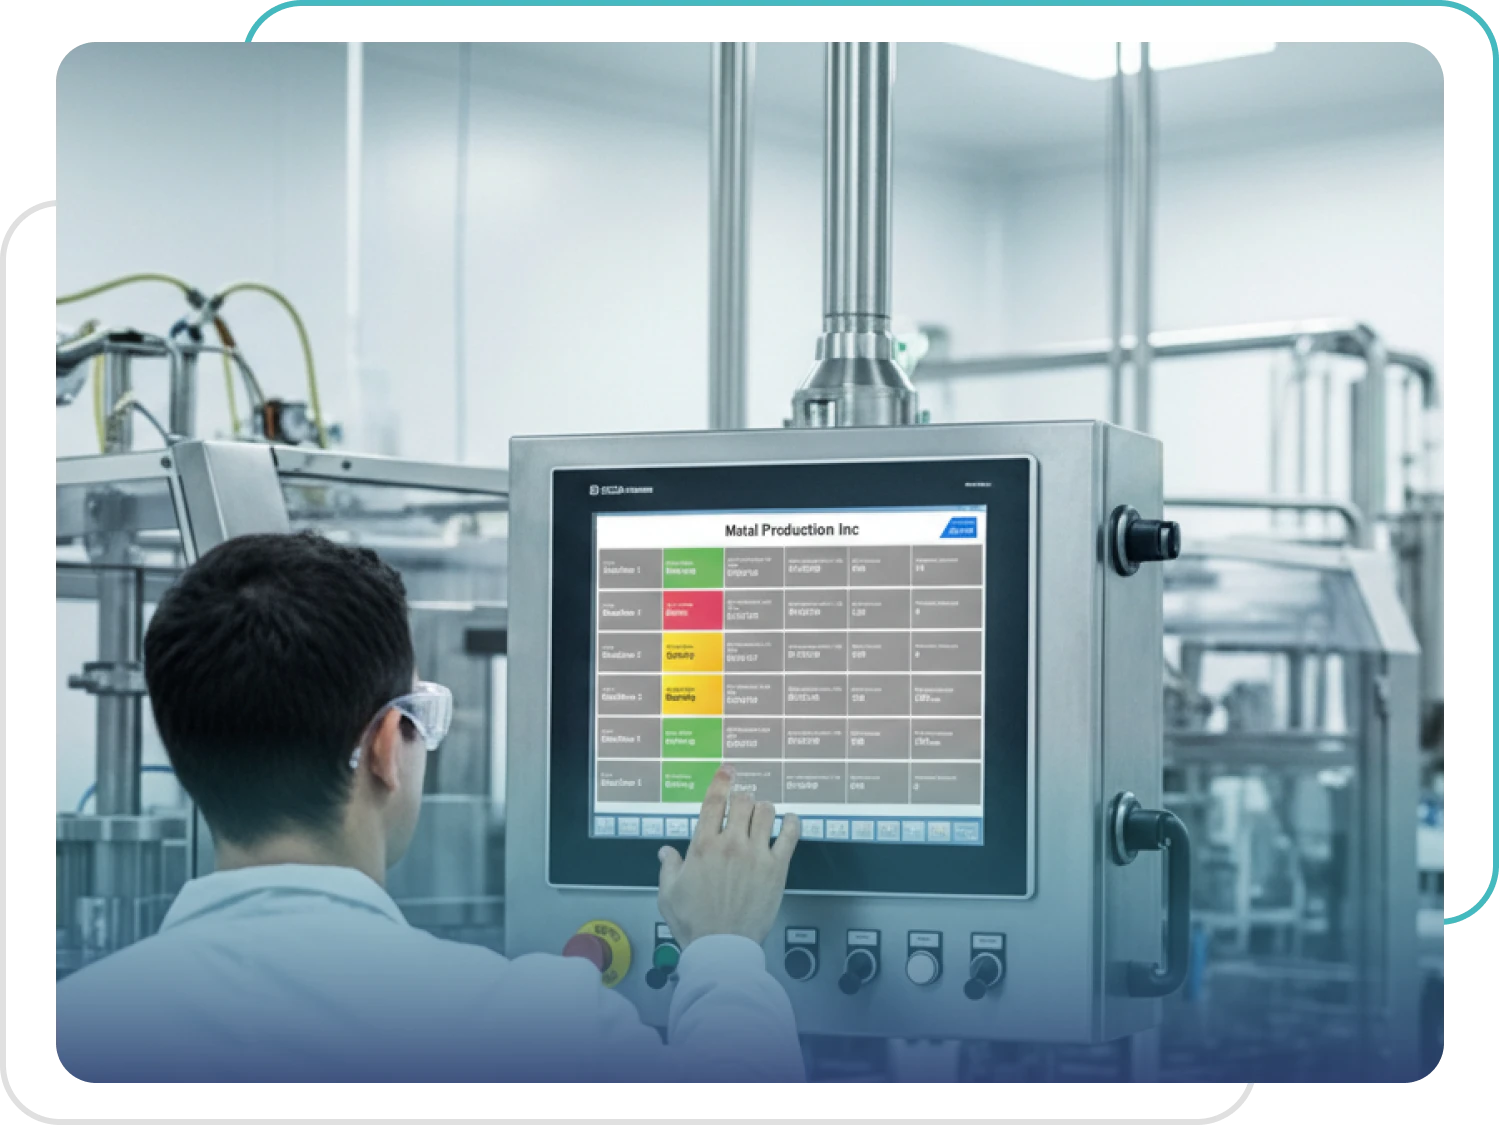
With the Dashboarding feature integrated into the Zerynth Platform, you can turn machine data into ready-to-use, fully customizable dashboards. Create personalized views, visualize KPIs, compare line trends, and monitor your entire production process, all from a single platform.
Your data, shaped your way
Give your data the format you need: monitor production, energy consumption, and performance in real time with dashboards built around your requirements.
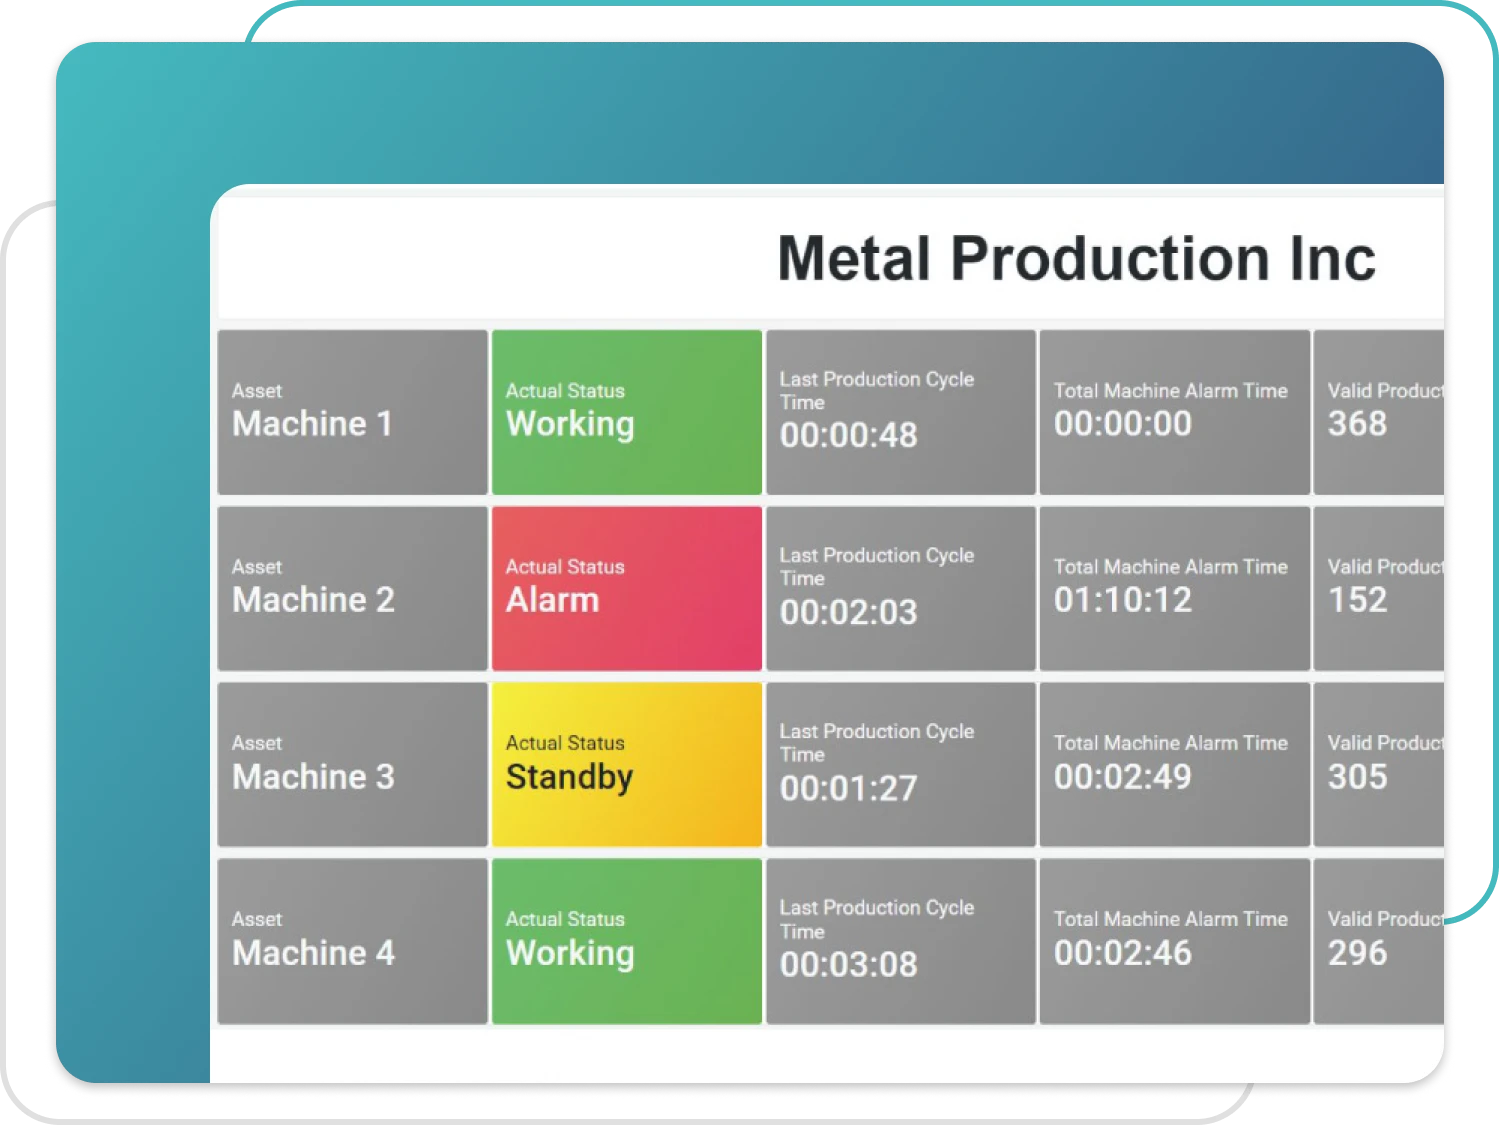
Custom Dashbords tailored to your needs
Want to go beyond the predefined KPIs available in the Zerynth portal? Your IT team—or Zerynth experts—can configure custom dashboards tailored to your specific strategic KPIs for production, energy consumption, and machine performance.
If you already use the Zerynth Industrial AI Copilot Platform, Dashboarding can also be activated as an additional service!
What can you do with Zerynth’s Dashboarding Engine?
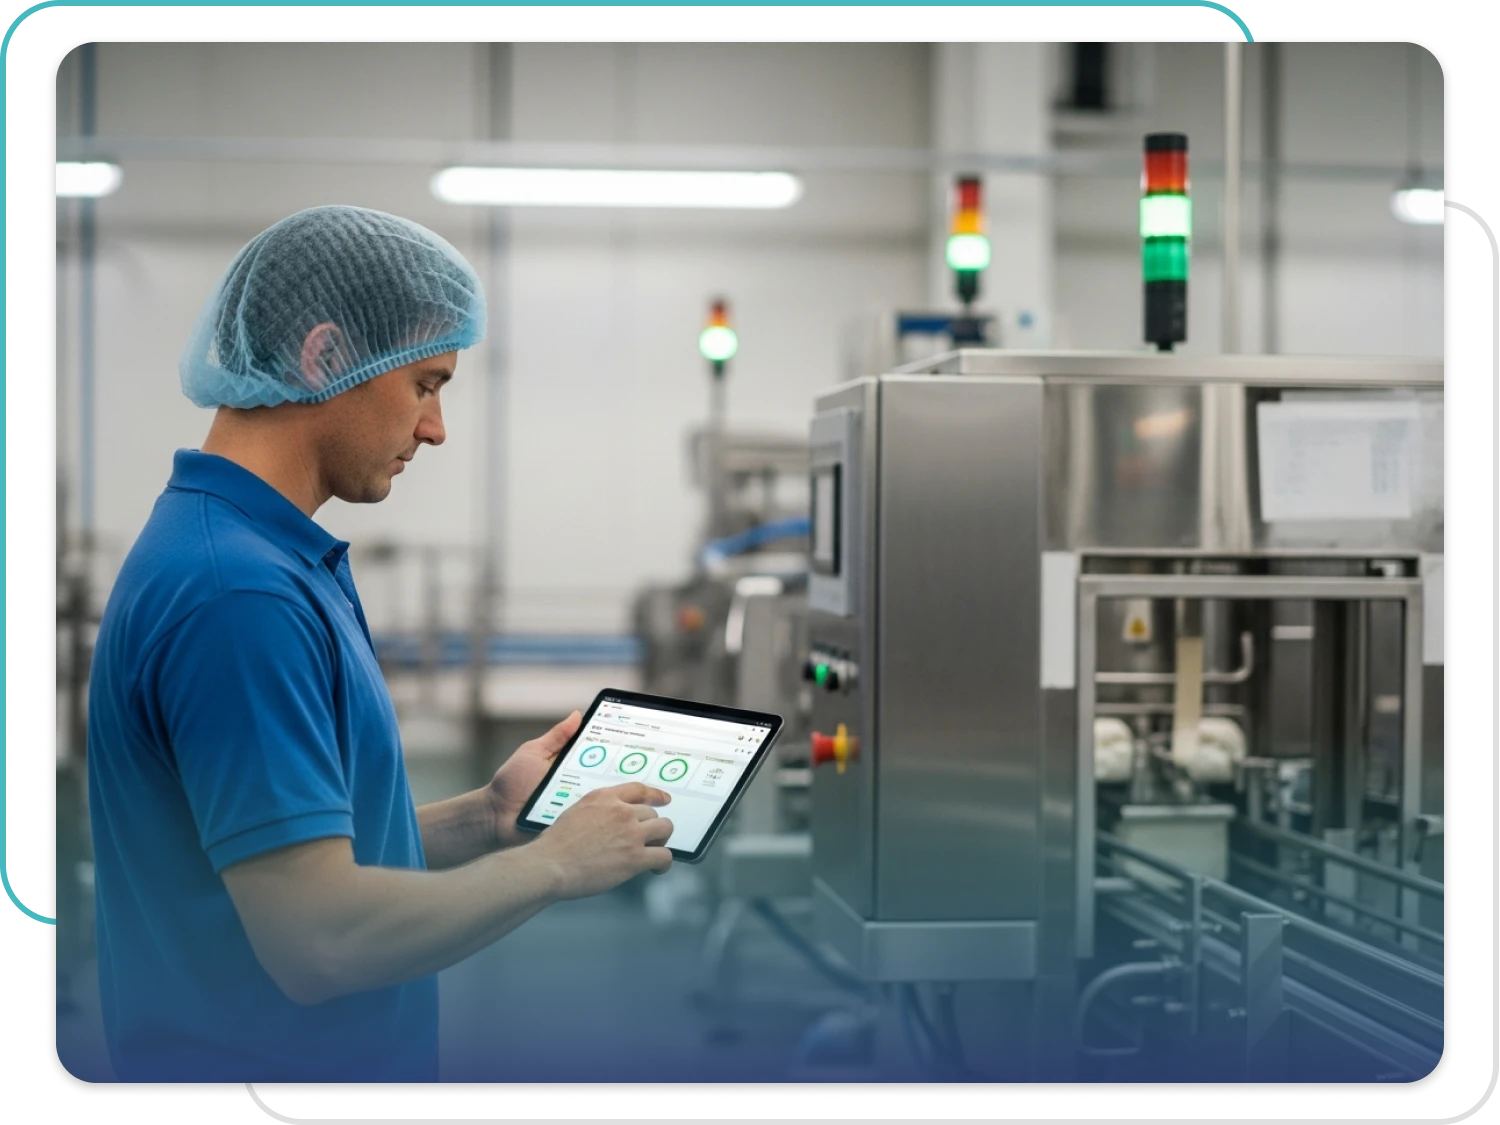
Monitor relevant KPIs in real time
Track production KPIs (and more) through personalized, always-up-to-date dashboards built around your needs.
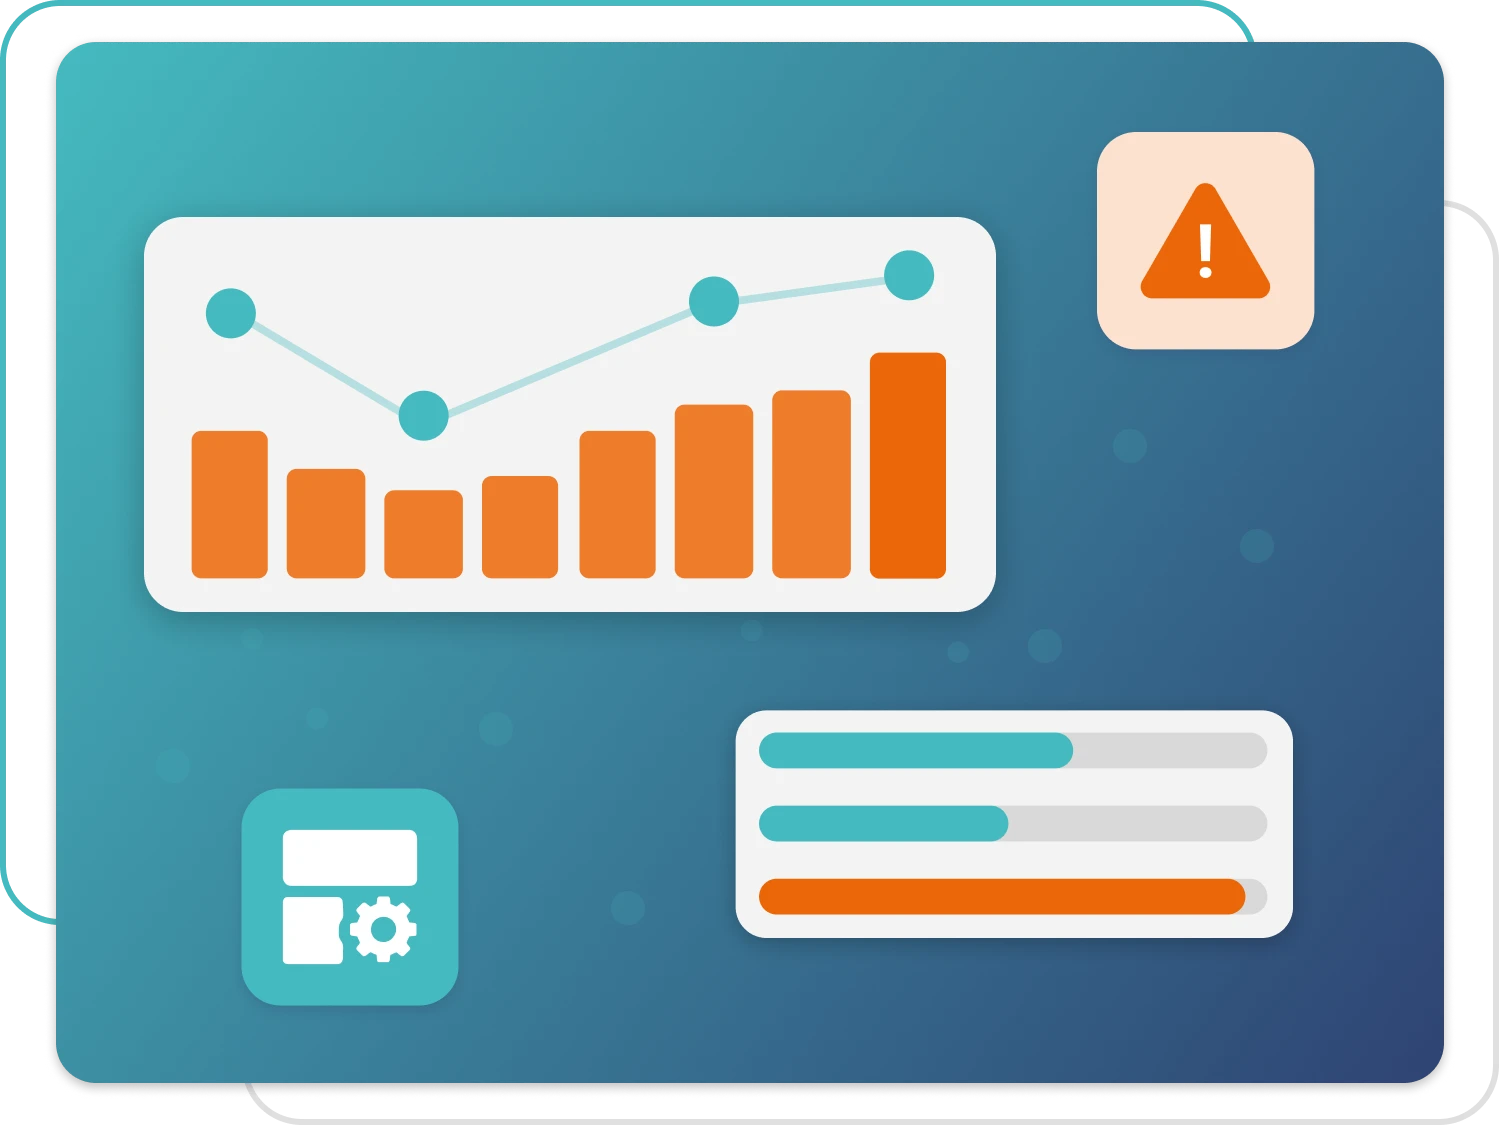
Analyze trend and anomalies
Visualize trends, deviations, and anomalies thanks to real-time, customizable panels.
Interact with machine data
Interact with machine data in real time, exploring flows, trends, and historical intervals with maximum flexibility in visualization and control.
