In a manufacturing context, identifying a machine’s “down” state is only the first step toward optimization. Knowing that a line is not producing is necessary information, but it is insufficient for initiating effective corrective actions.
The real difference in performance analysis lies in downtime categorization: the process of assigning a coded reason to every period of inactivity. Without proper downtime classification, efficiency data remains aggregated and lacks context, making it impossible to distinguish between technical criticalities, organizational shortcomings, or physiological delays. In this guide, we will analyze how to implement a rigorous downtime categorization system and how to integrate operator feedback to improve OEE (Overall Equipment Effectiveness).

The Technical Definition of Downtime Categorization
Categorizing a downtime event means associating a unique reason with every time interval during which an asset is not in a “working” state. This process allows for transforming chronometric data into managerial information that can be used for statistical analysis and continuous improvement.
In the factory, reasons for downtime are diverse, ranging from mechanical failures to material shortages, from format changes to scheduled maintenance. Accurate classification is the only solid foundation for identifying bottlenecks and correctly calculating equipment availability, avoiding the confusion of technical inefficiency with planned operational needs.
The Impact of Categorization on KPIs: Availability and Performance
OEE is the benchmark for measuring production efficiency, and downtime categorization directly affects its constituent factors.
Availability is influenced by prolonged machine stops. Without a distinction between planned stops (e.g., setup) and unplanned ones (e.g., failures), the availability calculation becomes distorted. Correct technical categorization allows for isolating asset reliability issues, providing reliable data for maintenance planning.
Performance, on the other hand, is undermined by micro-stops—short-duration pauses that often go unrecorded by traditional systems. The sum of these interruptions can heavily impact daily productivity. Categorizing these events allows for identifying recurring minor issues that, if ignored, consistently subtract production capacity.
Structuring an Effective Downtime Taxonomy
To obtain analyzable data, it is necessary to define a hierarchical structure of reasons that is comprehensive yet simple for operators to use. An excess of options inevitably leads to data entry errors or the systematic use of generic categories like “Other.” A methodological approach involves dividing reasons into macro-categories:
- Technical Downtime: Mechanical, electrical, or electronic anomalies that require maintenance intervention.
- Organizational Downtime: Delays related to logistics, raw material shortages, or lack of personnel.
- Process Downtime: Format changes, tooling, setup, and production trials.
- External Causes: Interruptions due to general services (energy, compressed air) or lack of orders.
Analyzing this data, conducted through tools such as Pareto charts, allows for identifying the causes that generate most of the lost time, directing investments and resources toward the problems with the greatest economic impact.
Integration Between IoT Data and Manual Declaration
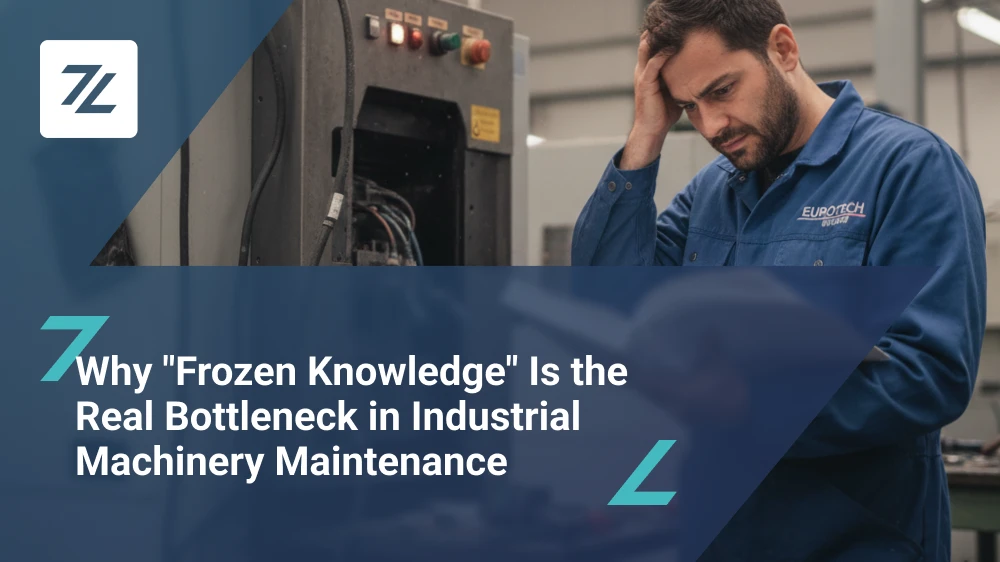
Modern monitoring relies on automatic data collection from PLCs or through external sensors that detect a change in machine state. Automation provides the certainty of the timestamp and the duration of the downtime, eliminating the subjectivity of manual recording. However, automation alone is often unable to provide the semantic context of the stop.
If an IoT system detects a stop due to a motor’s thermal protection, it cannot necessarily determine whether the cause is a mechanical overload or an operational error. Integrating deterministic machine data with operator declarations is fundamental to having a complete and correct view of inefficiencies.
Smart Operator Interface: Digitizing Manual Steps and Legacy Machinery
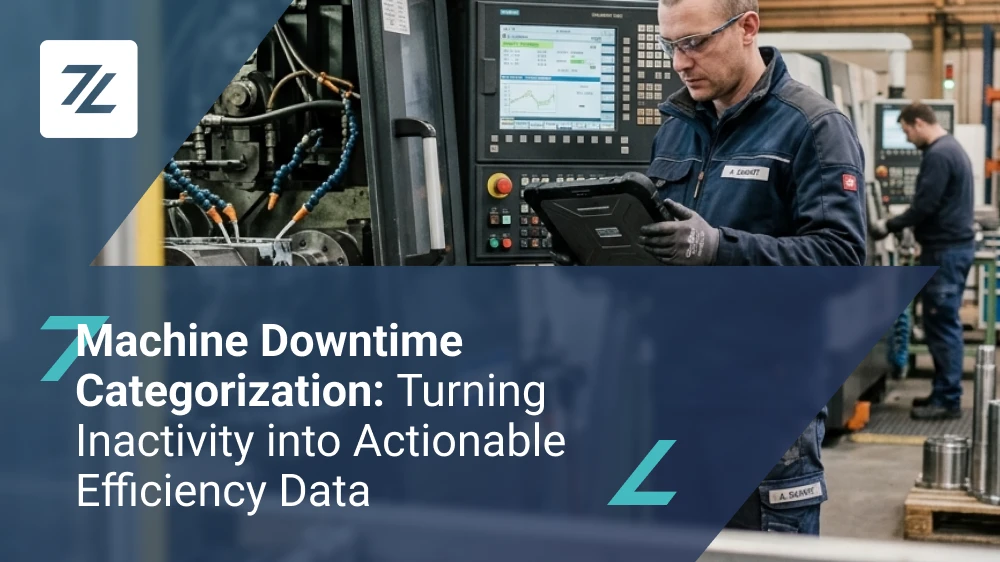
In every plant, there are areas where installing sensors is not technically possible or economically convenient, such as manual assembly stations or older machinery. In these cases, Zerynth’s Smart Operator Interface allows for digitizing process phases that would otherwise be excluded from monitoring.
Through the Interface, the operator manually declares the start and end of tasks, pieces produced, and any scraps directly on a tablet. This allows for collecting reliable data even for manual stations, integrating them into a single factory dashboard.
Furthermore, the Interface efficiently manages downtime notifications generated by connected machinery. When the platform detects an anomalous stop, it sends an alert to the operator, who can immediately categorize the event. This ensures that every downtime detected by machinery is promptly qualified, providing management with a consistent data base for the entire production process.
Efficiency Based on Real Data
Downtime categorization is not an administrative activity; it is a fundamental operational tool for reducing waste and increasing equipment saturation. Moving from management based on gut feelings to one based on objective and categorized data allows for making informed decisions and constantly improving the company’s competitiveness.
Zerynth technology facilitates this transition by combining the precision of IoT monitoring with the simplicity of operator interfaces, making factory digitalization a concrete and results-oriented process.