Quando il sistema gestionale mostra un ordine di produzione “al 60%”, cosa sta misurando davvero? Indica che sono stati realizzati 600 pezzi su 1.000, che è stato consumato il 60% del tempo previsto a tempario, oppure che 600 pezzi sono stati effettivamente verificati come conformi?
Senza una risposta univoca, il controllo dell’avanzamento della produzione rischia di basarsi su stime teoriche o percezioni soggettive. Nelle PMI manifatturiere, la gestione dell’avanzamento della produzione viene ancora spesso affidata alle sole dichiarazioni manuali raccolte a fine turno dagli operatori.
Per capire se una commessa sta procedendo secondo i piani occorre unire l’intenzione definita dall’ufficio programmazione con l’esecuzione fisica registrata sulla linea. Il vero monitoraggio dell’avanzamento nasce nel punto in cui i dati del gestionale incontrano la telemetria degli impianti.
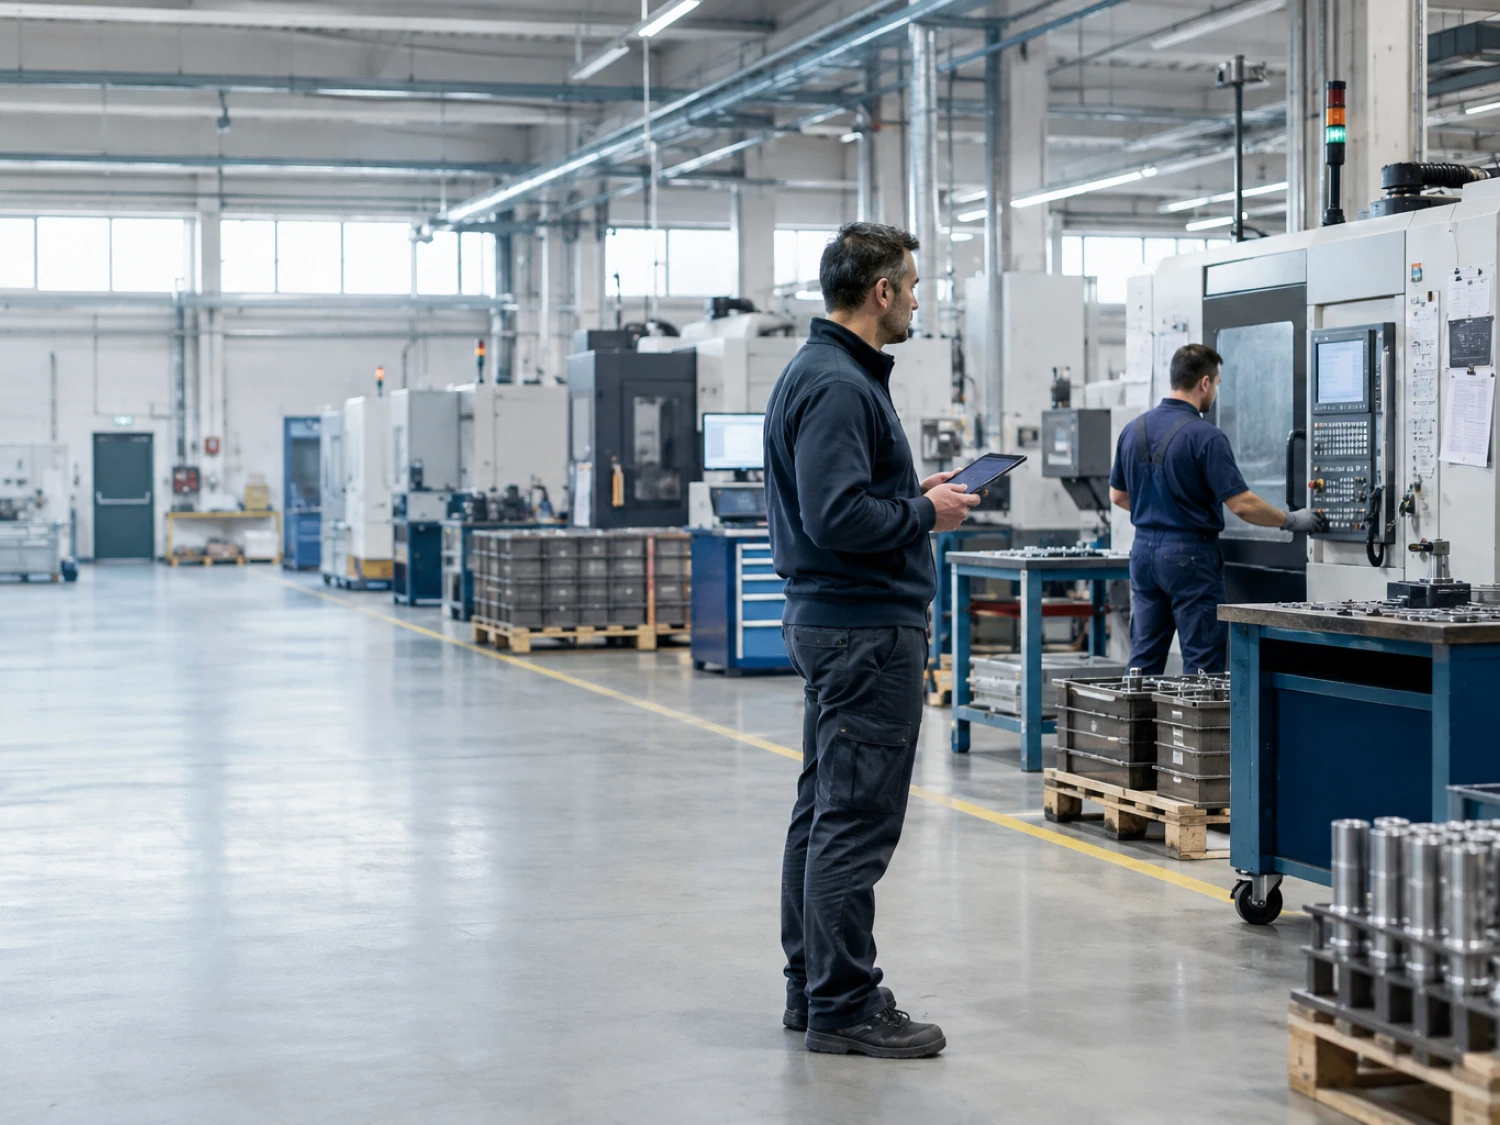
What controlling production progress really means
Tracking a production run requires a clear definition of the core operational entities. The production order (or work order) represents the business request to manufacture a specific item; the operation (or phase) defines a specific step in the routing; the work center (or asset) indicates the machine or workstation assigned to the task.
Effective control goes beyond counting raw units leaving the conveyor belt. You must continuously distinguish between total units produced and good units that meet quality specifications.
Evaluating order progress requires looking at three axes simultaneously:
- Good quantity completed relative to total batch size.
- Actual elapsed time since the operation started.
- Estimated remaining time to completion.
An order can look perfectly on schedule when evaluated solely on piece count. However, if producing those pieces has already consumed 80% of the total time budget, the job is already behind schedule.
Why declared progress and real progress diverge
Manual production declarations gathered at the end of a shift carry inherent limitations. Operators frequently record rounded times, combine micro-stops into general working time, or log entries hours after events occur.
Traditional MES HMIs rely heavily on manual operator inputs. As a result, the accuracy of execution times and machine status updates depends on how promptly workers log their activity.
Without an active production order assigned, a idle machine represents unallocated time. In that scenario, you cannot tell whether the inactivity points to a bottleneck or simply a lack of scheduled work.
When an active order is linked to the machine, the exact same idle interval becomes measurable downtime because the machine was expected to produce and did not. Order context transforms raw machine signals into actionable information for production progress control.
The five sources of variance from plan and how to spot them in machine data
Discrepancies between planned schedules and actual shop floor progress stem from five main sources. Each leaves a distinct signature in machine data:
- Unplanned downtime: the machine stops during an active order. Understanding the root cause requires combining physical machine status with operational downtime reasons. To learn more about data-driven maintenance strategies, read about Maintenance 4.0.
- Setup and changeover duration: the time gap between order start declaration and the first actual machine cycle. Extended setup times create a delay that propagates across the entire batch.
- Real execution speed: the machine runs continuously but at a slower cycle time than the reference standard. This represents a hidden performance loss, visible only through cycle-by-cycle automated tracking.
- Scrap and quality losses: the machine produces parts that fail quality inspection. Calculating progress on total output masks the portion of work that requires rework or scrapping.
- Resource availability: the assigned machine is busy with prior jobs or blocked by upstream line constraints.
These five loss factors feed into Overall Equipment Effectiveness (OEE), combining Availability, Performance, and Quality. A machine has only one OEE; what varies is the specificity of the reference time used to measure it.
Work order management and the minimal data model
Building an effective work order management framework does not require creating isolated data silos. The goal is to connect ERP master data with physical shop floor events.
The table below outlines the minimal data model required to link production planning with shop floor execution:
| Entity | What it represents | Why it matters |
|---|---|---|
| Product / item | What needs to be manufactured | Links production to the expected economic and technical outcome |
| Phase / operation | A step in the production cycle, with sequence and ERP references | Shows which operation creates variability, delays or inefficiencies |
| Work order | The actual production instance: quantity, dates, status, progress | Brings the business demand into the shop floor context |
| Asset / work center | The resources and locations where production happens | Connects each order to the physical reality of the factory |
| Execution events | Machine states, good parts, scrap, stops, setup, actual times | Make the plan comparable with observed reality |
| Machine configuration | Part program, tooling, material, parameters | Explains why the same operation yields different results |
| Energy consumption | Energy linked to an order or operation | Connects production efficiency, cost and sustainability |
Connecting these entities creates a complete foundation for work order management, turning raw machine signals into structured operational insights.
Practical application: how Smart Operations fits in
Smart Operations is Zerynth’s solution that connects ERP production orders with shop floor reality. It unifies operation phases, IoT machine telemetry, operator declarations, and energy consumption into a single operational view to reveal true order progress and explain the root causes of delays.
The ERP system remains the primary source for production orders, integrating via dedicated connectors. Any existing MES enriches operational context without needing replacement. To learn more about integration architectures, read our article on IoT and integration with ERP and MES.
Within the platform, the AI Copilot Zero helps plant managers identify at-risk orders and analyze the causes of variance across cycle times, downtime, setup, and scrap. Zero provides transparent data citations for its answers, reducing the time needed to investigate shop floor anomalies.
To explore available features and options, visit the Zerynth pricing page.
Share This Story, Choose Your Platform!
About the Author: Marco Graziotti